
On Saturday, 7 November 2026, New Zealand will elect a new House of Representatives. This is our first projection for the election, based on the poll.graphics election trend of 1 October and the 2023 results, transferred onto the new electorate boundaries that apply for the first time this year.
The poll.graphics election trend is not a poll of its own. It is a weighted average of all publicly available polls for the general election: 37 so far this year, most recently the 1News-Verian poll of 27 September. Averaging smooths out the outliers of individual polling companies, so the trend can give a steadier picture than any single poll.
National and Labour are level on the party vote, 28.9 against 28.8 per cent. Neither the current government of National, ACT and NZ First nor the opposition parties of Labour, the Greens and Te Pāti Māori would have a majority of its own. With 8 projected seats, The Opportunity Party (TOP) would decide which side can govern.
Key points
- Neither bloc has a majority. National, ACT and NZ First would win 59 of 120 seats, two short of the 61 needed. Labour, the Greens and Te Pāti Māori would win 53, eight short.
- THE OPPORTUNITY PARTY holds the balance. The Opportunity Party would clear the 5 per cent threshold at 6.2 per cent and also win the Ilam electorate. With The Opportunity Party’s 8 seats, the centre-right would reach 67 seats. The centre-left would reach exactly 61, a majority of one.
- The centre-right lost its majority in July. From January to June the government parties had 61 to 63 seats in our projection. From July on they had 59, as The Opportunity Party gained in the polls and entered the projection through Ilam.
- Labour would win 14 more electorates than in 2023, but no longer leads the electorate count. National would lead in 32 electorates, Labour in 30. From January to August, Labour led the electorate count in every month.
- Eleven electorates are within 5 points. Nine are National–Labour contests. The closest is Hamilton East, where the gap is less than half a point.
Seat distribution on 1 October
The poll.graphics election trend for 1 October is: National 28.9%, Labour 28.8%, Greens 13.2%, NZ First 10.3%, ACT 9.3%, The Opportunity Party 6.2%, Te Pāti Māori 2.0%, others 1.5%. The trend and the electorate projections give the following seat distribution for the House of Representatives:
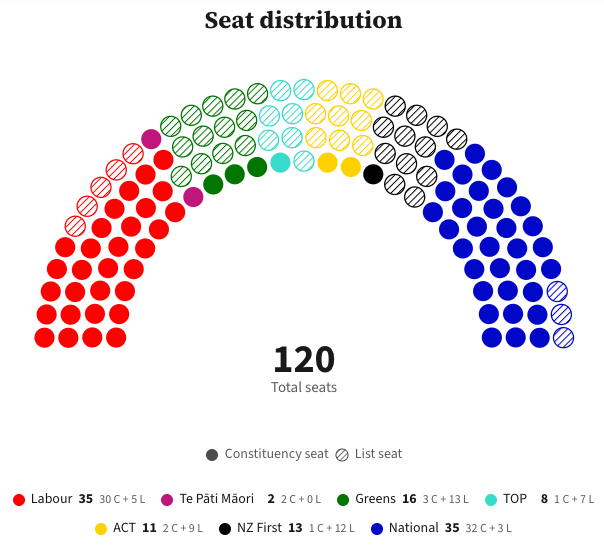
| Party | Party vote | Electorates | List | Seats |
|---|---|---|---|---|
| National | 28.9% | 32 | 3 | 35 |
| Labour | 28.8% | 30 | 5 | 35 |
| Greens | 13.2% | 3 | 13 | 16 |
| NZ First | 10.3% | 1 | 12 | 13 |
| ACT | 9.3% | 2 | 9 | 11 |
| TOP | 6.2% | 1 | 7 | 8 |
| Te Pāti Māori | 2.0% | 2 | 0 | 2 |
| Total | 71 | 49 | 120 |
New Zealand uses mixed-member proportional representation (MMP). The party vote decides how many seats each party gets. Electorate winners take their seats first, and each party’s remaining seats are filled from its list. A party needs 5 per cent of the party vote or one electorate to share in the list seats.
In our projection the House has exactly 120 seats. That differs from 2023, when Te Pāti Māori won six electorates but was entitled to only about four seats on its party vote. The two extra seats stayed as overhang, and the House grew to 122. In this projection Te Pāti Māori would win two electorates, and 2.0 per cent of the party vote covers both, so there is no overhang. The majority threshold is therefore 61.
Does the centre-left or the centre-right have a majority?
Neither. The current government of National, ACT and NZ First would win 59 seats, two short of a majority. Labour, the Greens and Te Pāti Māori would win 53 seats, eight short.
| Combination | Seats | Majority (61)? |
|---|---|---|
| National + ACT + NZ First + TOP | 67 | yes (+6) |
| Labour + Greens + Te Pāti Māori + TOP | 61 | yes (±0) |
| National + ACT + NZ First (government since 2023) | 59 | no (−2) |
| Labour + Greens + TOP | 59 | no (−2) |
| Labour + Greens + Te Pāti Māori | 53 | no (−8) |
| National + ACT | 46 | no (−15) |
The Opportunity Party would be the kingmaker. With The Opportunity Party, the centre-right would have a clear majority of 67 seats. The centre-left would reach 61 only if all four parties took part, including Te Pāti Māori with its two electorate seats. Whether The Opportunity Party would support either side is a political question that our projection cannot answer.
The electorate clause works twice for The Opportunity Party. At 6.2 per cent The Opportunity Party clears the threshold, but not by much. In our projection it also wins Ilam, one of the safest leads on the map. An electorate win would keep The Opportunity Party in Parliament even below 5 per cent. The same applies to Te Pāti Māori: at 2.0 per cent, its seats depend entirely on winning at least one Māori electorate.
The balance probably does not depend on the Māori electorates. In 2023 Te Pāti Māori won six of the seven Māori electorates. Our projection gives it two. If it won six again, it would gain four overhang seats. The House would grow to 124 and the majority threshold to 63. Assuming the other parties’ seats stayed the same, the centre-left would have 57 seats and the centre-right 59. Neither would have a majority, and The Opportunity Party would still decide. This is a rough calculation, not a model result, but it shows that the overall picture does not depend on the Māori electorates.
The two blocs since January
Total seats by bloc in our projection. Data points on the first day of each month.
The chart shows two developments:
1. The Opportunity Party entered the House in projection from July onwards. Until June, The Opportunity Party polled between 1 and 3 per cent and won no seats in our projection. On 1 July it would have won Ilam and, through the electorate clause, entered the House with 4 seats while still below 5 per cent. Since then its party vote has almost doubled. Between June and October those 8 seats came from both blocs equally: 4 from the centre-right and 4 from the centre-left.
2. The government lost its majority when The Opportunity Party entered. National, ACT and NZ First held 61 to 63 seats in every month up to June. The centre-right vote hardly changed, but once The Opportunity Party’s seats came into play, the government parties dropped to 59. The centre-left never had a majority in this period. Its best result was 59 seats in January, March, April and May.
The 71 electorates: who leads where
The seat totals above are decided by the party vote. The electorate vote decides who represents each of the 71 electorates, and for the smaller parties it can decide whether they enter Parliament at all.
The electorates since January
Electorates each party would win in our projection. Data points on the first day of each month.
In 2023, on the new boundaries, National won 44 electorates, Labour 16, Te Pāti Māori 6, the Greens 3 and ACT 2.
Labour lost its lead in the electorates. In spring, Labour’s electorate lead grew to 37 against 28 for National on 1 May. After that it shrank as Labour’s party vote fell by six and a half points, from 35.3 to 28.8 per cent, while National’s stayed around 29 to 30 per cent. On 1 September National took the lead in the electorate count for the first time this year.
Strongest party and strongest competitor
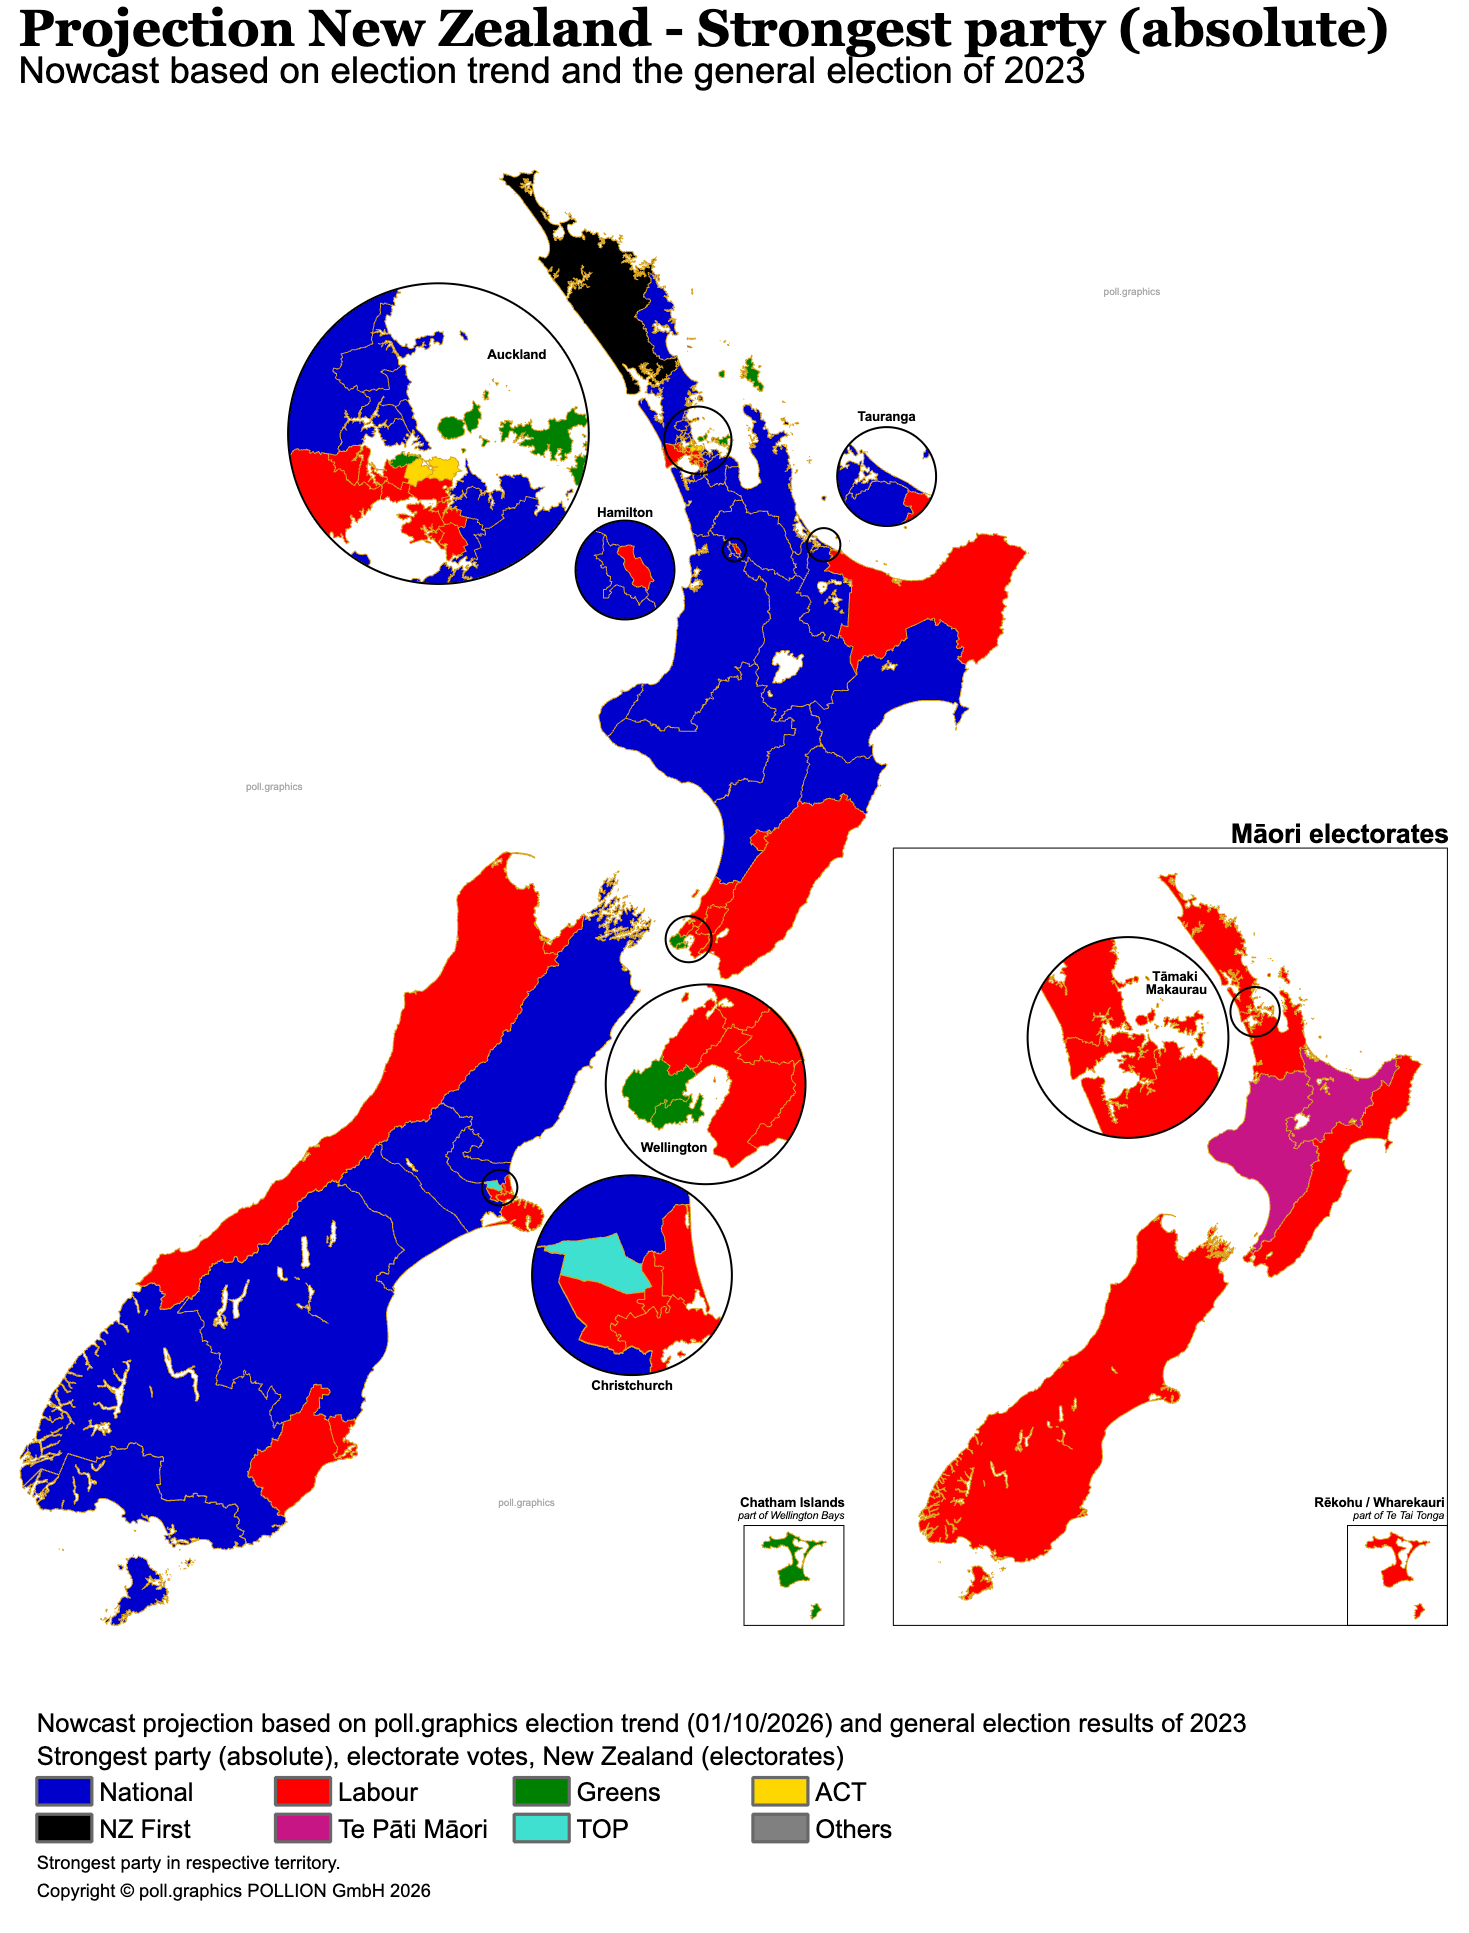
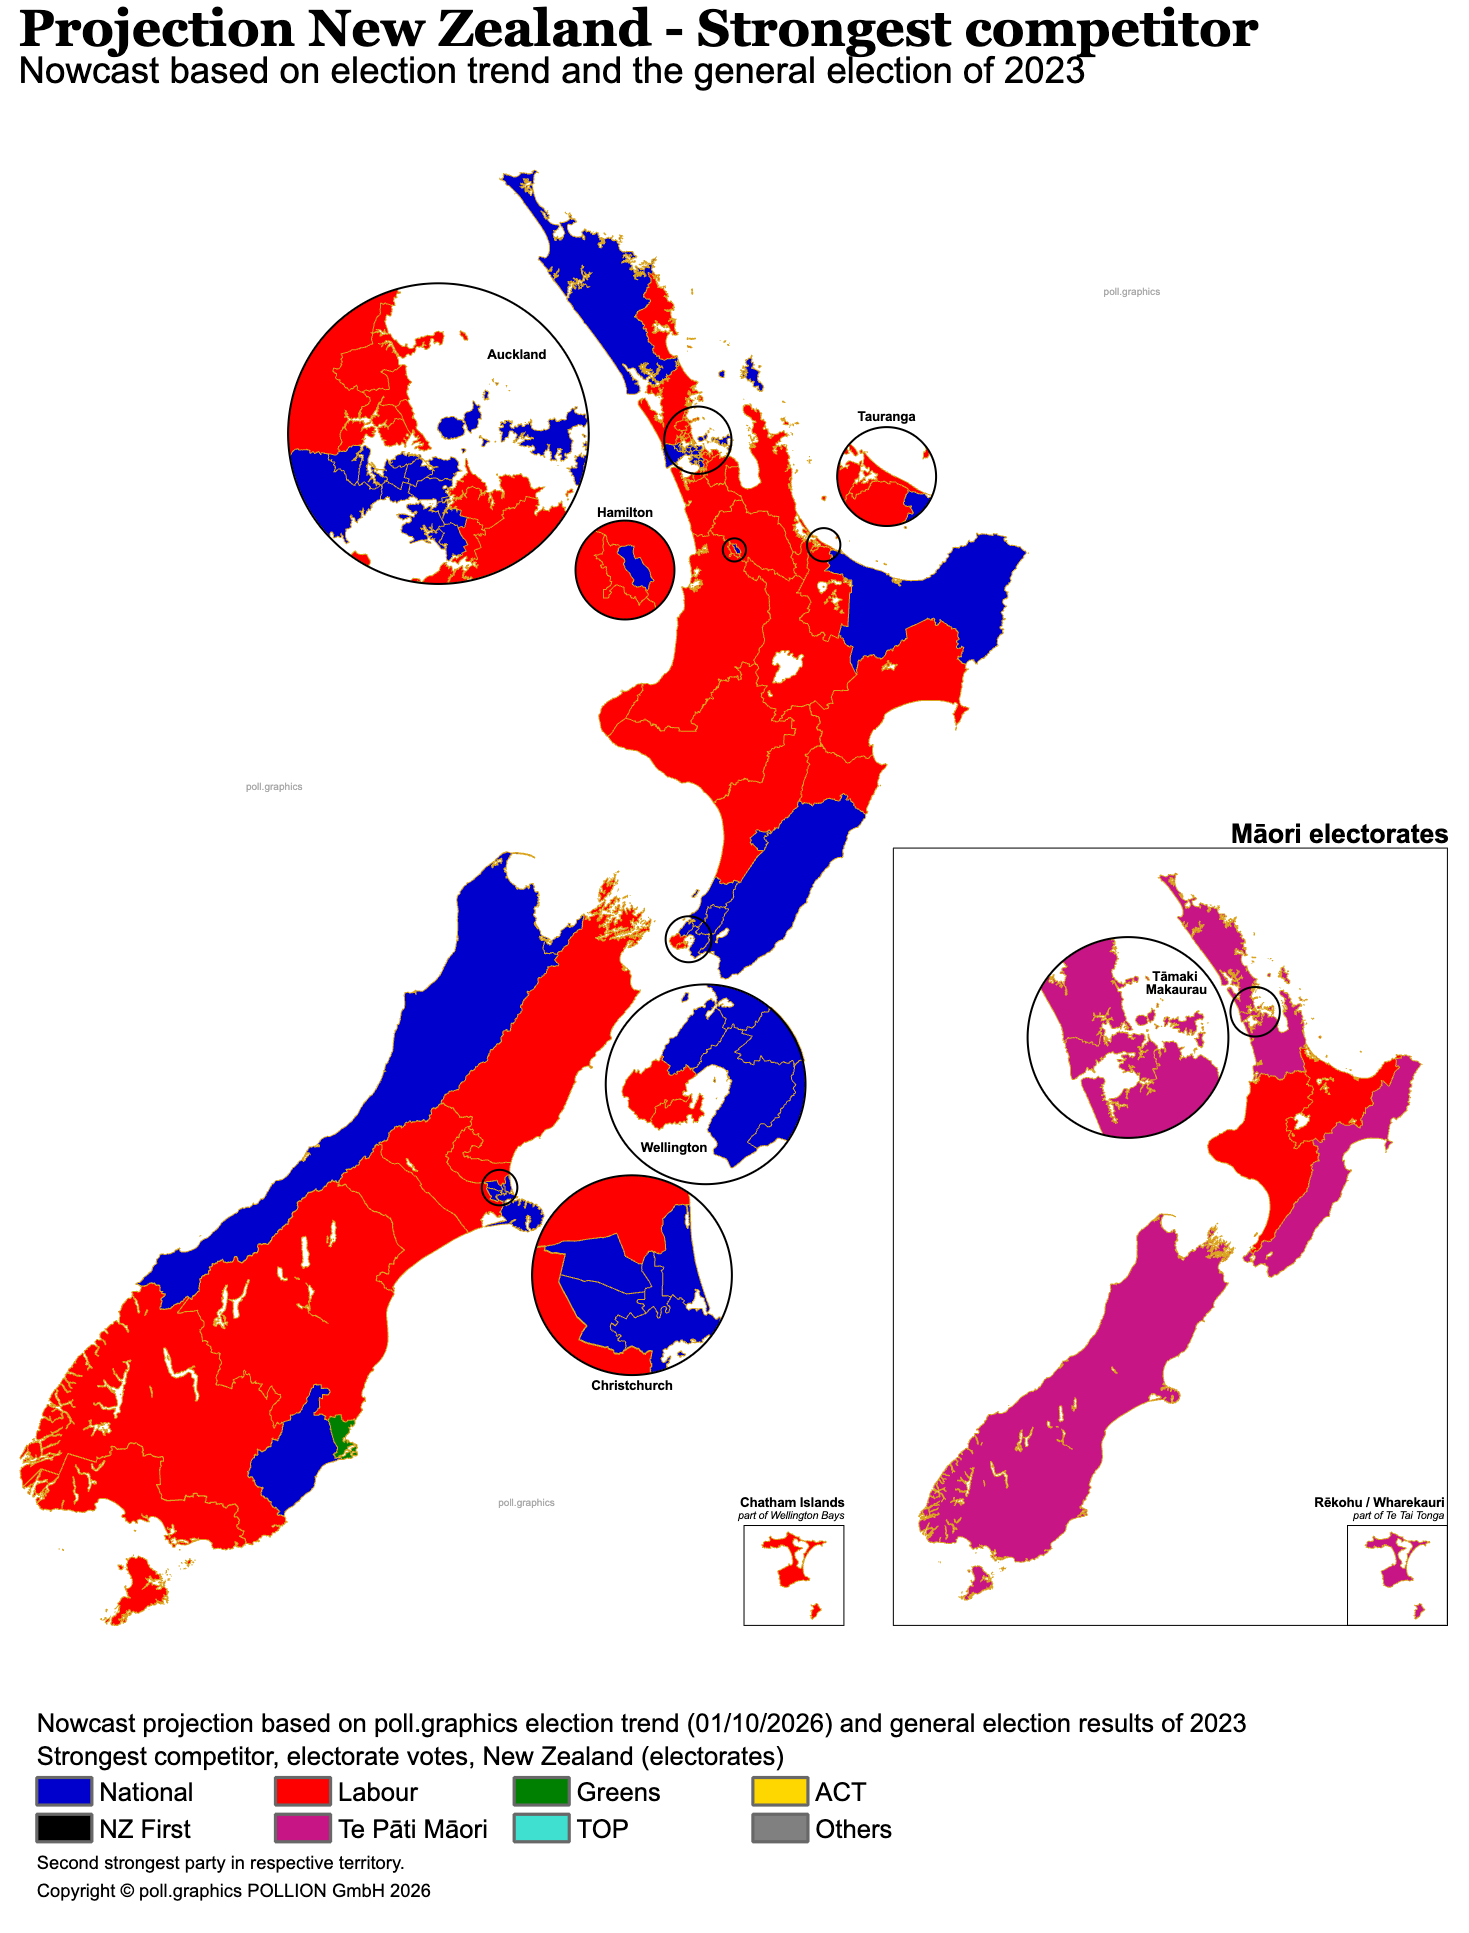
The left-hand map shows which party would lead the electorate vote in each electorate: National in 32, Labour in 30, the Greens in 3 (Auckland Central, Wellington Bays, Wellington North), ACT in 2 (Epsom, Tāmaki), Te Pāti Māori in 2 (Te Tai Hauāuru, Waiariki), NZ First in Northland and The Opportunity Party in Ilam.
Compared with the 2023 result on the new boundaries, 16 electorates would change hands. National would lose twelve: ten to Labour, Northland to NZ First and Ilam to The Opportunity Party. Te Pāti Māori would lose four Māori electorates to Labour: Hauraki-Waikato, Tāmaki Makaurau, Te Tai Tokerau and Te Tai Tonga. Most of National’s losses to Labour are in the suburbs of Auckland, Wellington and Christchurch and in the regional seats around them, including Mt Roskill, Maungakiekie, Hutt South, Kapiti, Wigram, Banks Peninsula, Wairarapa and West Coast-Tasman.
The right-hand map shows who would come second. In 56 of the 71 electorates the race is between National and Labour. National leads in 32 of them and Labour in 24. The other pairings are more regional. They are listed with their electorates in the table of competitive pairings below.
Competitive pairings
The map below combines the two maps above. Each electorate shows the two parties that are first and second, no matter which of them leads.
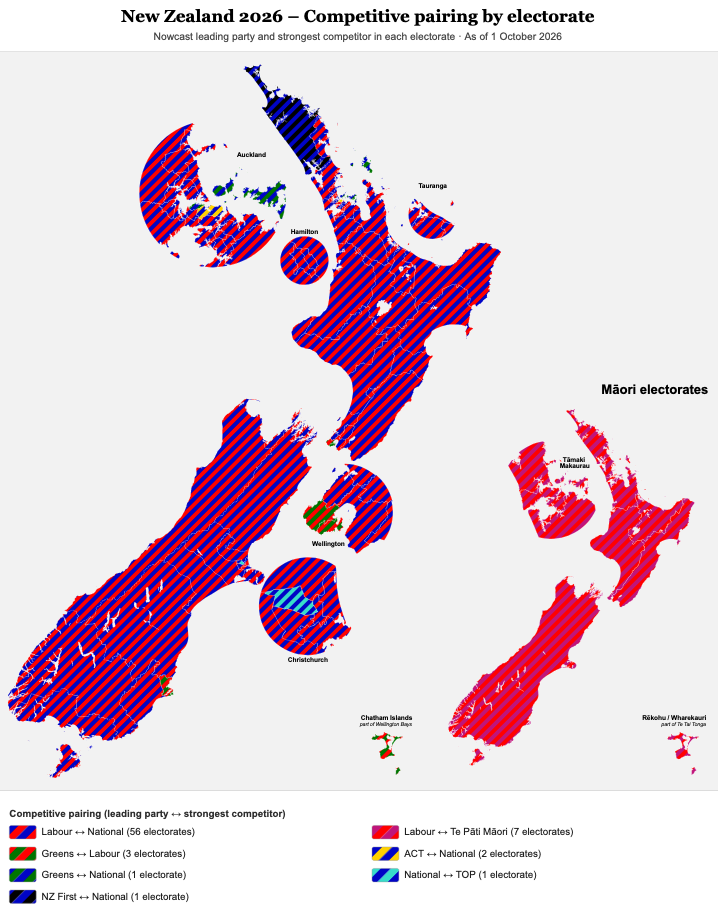
| Pairing | Electorates |
|---|---|
| Labour ↔ National | 56 |
| Labour ↔ Te Pāti Māori (all seven Māori electorates) | 7 |
| Greens ↔ Labour (Dunedin, Wellington Bays, Wellington North) | 3 |
| ACT ↔ National (Epsom, Tāmaki) | 2 |
| Greens ↔ National (Auckland Central) | 1 |
| NZ First ↔ National (Northland) | 1 |
| National ↔ TOP (Ilam) | 1 |
What the pairings show: New Zealand has several separate contests. In the 64 general electorates, 56 are National–Labour races. The exceptions are all urban or local: the Greens in central Auckland, Wellington and Dunedin, ACT in Epsom and Tāmaki, NZ First in Northland and TOP in Ilam. In the seven Māori electorates the race is Labour against Te Pāti Māori everywhere. Every electorate pairing involves either National or Labour.
All 71 electorates
The three strongest parties in every electorate on 1 October, ranked by projected electorate vote. Rows highlighted in yellow would change hands compared with 2023 (on the new boundaries). Each name links to the electorate page with the full projection.
The status comes from the Monte Carlo simulation of 1 October with 15,000 runs. In each run, the electorate vote shares of all parties vary at random, and we count how often each party wins the electorate. The status depends on the gap between the win probabilities of the two strongest parties:
| Status | Gap in win probability | Meaning | Electorates (1 Oct) |
|---|---|---|---|
| 🔴 Toss-up | < 10 pts | Open race, could go either way | 1 |
| 🟠 Contested | 10 – 50 pts | A lead, but vulnerable | 17 |
| 🟡 Lean | 50 – 90 pts | Clear advantage, but not out of reach | 26 |
| 🟢 Safe | > 90 pts | Practically certain at present | 27 |
All seven Māori electorates are rated Contested or Lean, and none is Safe. Hamilton East is the only Toss-up.
| No. | Electorate | 1st | 2nd | 3rd | Status |
|---|---|---|---|---|---|
| General electorates | |||||
| 1 | Auckland Central | Greens | National | Labour | 🟡 Lean |
| 2 | Banks Peninsula | Labour | National | Greens | 🟡 Lean |
| 3 | Botany | National | Labour | Greens | 🟢 Safe |
| 4 | Christchurch Central | Labour | National | Greens | 🟢 Safe |
| 5 | Christchurch East | Labour | National | Greens | 🟢 Safe |
| 6 | Coromandel | National | Labour | Greens | 🟢 Safe |
| 7 | Dunedin | Labour | Greens | National | 🟢 Safe |
| 8 | East Cape | Labour | National | NZ First | 🟠 Contested |
| 9 | East Coast Bays | National | Labour | NZ First | 🟢 Safe |
| 10 | Epsom | ACT | National | Labour | 🟢 Safe |
| 11 | Glendene | Labour | National | Greens | 🟢 Safe |
| 12 | Hamilton East | Labour | National | Greens | 🔴 Toss-up |
| 13 | Hamilton West | National | Labour | Greens | 🟠 Contested |
| 14 | Henderson | Labour | National | Greens | 🟢 Safe |
| 15 | Hutt South | Labour | National | TOP | 🟡 Lean |
| 16 | Ilam | TOP | National | Labour | 🟡 Lean |
| 17 | Invercargill | National | Labour | NZ First | 🟡 Lean |
| 18 | Kaikōura | National | Labour | NZ First | 🟢 Safe |
| 19 | Kaipara ki Mahurangi | National | Labour | Greens | 🟢 Safe |
| 20 | Kapiti | Labour | National | Greens | 🟠 Contested |
| 21 | Kenepuru | Labour | National | Greens | 🟢 Safe |
| 22 | Māngere | Labour | National | Greens | 🟢 Safe |
| 23 | Manurewa | Labour | National | Greens | 🟢 Safe |
| 24 | Maungakiekie | Labour | National | Greens | 🟠 Contested |
| 25 | Mt Albert | Labour | National | Greens | 🟡 Lean |
| 26 | Mt Maunganui | National | Labour | NZ First | 🟢 Safe |
| 27 | Mt Roskill | Labour | National | Greens | 🟠 Contested |
| 28 | Napier | National | Labour | NZ First | 🟡 Lean |
| 29 | Nelson | Labour | National | NZ First | 🟡 Lean |
| 30 | New Plymouth | National | Labour | NZ First | 🟠 Contested |
| 31 | North Shore | National | Labour | Greens | 🟢 Safe |
| 32 | Northcote | National | Labour | Greens | 🟡 Lean |
| 33 | Northland | NZ First | National | Labour | 🟠 Contested |
| 34 | Ōtāhuhu | Labour | National | Greens | 🟢 Safe |
| 35 | Pakuranga | National | Labour | Greens | 🟢 Safe |
| 36 | Palmerston North | Labour | National | Greens | 🟡 Lean |
| 37 | Papakura | National | Labour | ACT | 🟡 Lean |
| 38 | Port Waikato | National | Labour | ACT | 🟢 Safe |
| 39 | Rangitata | National | Labour | ACT | 🟡 Lean |
| 40 | Rangitīkei | National | Labour | ACT | 🟡 Lean |
| 41 | Remutaka | Labour | National | Greens | 🟢 Safe |
| 42 | Rotorua | National | Labour | ACT | 🟡 Lean |
| 43 | Selwyn | National | Labour | Greens | 🟢 Safe |
| 44 | Southland | National | Labour | Greens | 🟢 Safe |
| 45 | Taieri | Labour | National | NZ First | 🟡 Lean |
| 46 | Takanini | National | Labour | Greens | 🟠 Contested |
| 47 | Tāmaki | ACT | National | Labour | 🟡 Lean |
| 48 | Taranaki-King Country | National | Labour | Others | 🟢 Safe |
| 49 | Taupō | National | Labour | Greens | 🟢 Safe |
| 50 | Tauranga | National | Labour | NZ First | 🟡 Lean |
| 51 | Tukituki | National | Labour | NZ First | 🟡 Lean |
| 52 | Upper Harbour | National | Labour | Greens | 🟢 Safe |
| 53 | Waikato | National | Labour | NZ First | 🟢 Safe |
| 54 | Waimakariri | National | Labour | NZ First | 🟡 Lean |
| 55 | Wairarapa | Labour | National | ACT | 🟡 Lean |
| 56 | Waitākere | Labour | National | Greens | 🟡 Lean |
| 57 | Waitaki | National | Labour | Greens | 🟡 Lean |
| 58 | Wellington Bays | Greens | Labour | National | 🟡 Lean |
| 59 | Wellington North | Greens | Labour | National | 🟠 Contested |
| 60 | West Coast-Tasman | Labour | National | Others | 🟡 Lean |
| 61 | Whanganui | National | Labour | NZ First | 🟠 Contested |
| 62 | Whangaparāoa | National | Labour | NZ First | 🟢 Safe |
| 63 | Whangārei | National | Labour | NZ First | 🟡 Lean |
| 64 | Wigram | Labour | National | TOP | 🟠 Contested |
| Māori electorates | |||||
| 65 | Hauraki-Waikato | Labour | Te Pāti Māori | Greens | 🟠 Contested |
| 66 | Ikaroa-Rāwhiti | Labour | Te Pāti Māori | Greens | 🟡 Lean |
| 67 | Tāmaki Makaurau | Labour | Te Pāti Māori | Greens | 🟠 Contested |
| 68 | Te Tai Hauāuru | Te Pāti Māori | Labour | Greens | 🟠 Contested |
| 69 | Te Tai Tokerau | Labour | Te Pāti Māori | Greens | 🟠 Contested |
| 70 | Te Tai Tonga | Labour | Te Pāti Māori | Greens | 🟠 Contested |
| 71 | Waiariki | Te Pāti Māori | Labour | NZ First | 🟠 Contested |
For the yellow highlighting, Port Waikato counts as a National seat in 2023: the electorate vote was cancelled after a candidate died, and National won the by-election that followed.
Battleground electorates
In eleven electorates the leading and second-placed parties are less than five percentage points apart:
| Electorate | Ahead | Second | Margin | 2023 |
|---|---|---|---|---|
| Hamilton East | Labour | National | < 5 pt | National |
| New Plymouth | National | Labour | < 5 pt | National |
| Whanganui | National | Labour | < 5 pt | National |
| Kapiti | Labour | National | < 5 pt | National |
| Mt Roskill | Labour | National | < 5 pt | National |
| Northland | NZ First | National | < 5 pt | National |
| Maungakiekie | Labour | National | < 5 pt | National |
| Hamilton West | National | Labour | < 5 pt | National |
| Takanini | National | Labour | < 5 pt | National |
| East Cape | Labour | National | < 5 pt | National |
| Wellington North | Greens | Labour | < 5 pt | Greens |
Nine of the eleven are National–Labour contests, and National won all of them in 2023. Four are in the Waikato and Taranaki–Manawatū (Hamilton East, Hamilton West, New Plymouth, Whanganui) and three are in Auckland (Mt Roskill, Maungakiekie, Takanini). Another eleven electorates are within five to ten points, including two Māori electorates, Te Tai Tonga and Hauraki-Waikato.
Under MMP, most of these races decide who sits in Parliament, not how big each party is. If Labour wins Hamilton East, it gets one list seat fewer, and its total stays the same. Electorates change the balance of power in only two situations:
- Lifelines. An electorate win lets a party below 5 per cent into Parliament. On the current trend this matters for Te Pāti Māori, which has a lead in Te Tai Hauāuru. It also matters for The Opportunity Party if its party vote slips below the threshold. The Opportunity Party’s lead in Ilam is one of the largest on the map. Northland is not a lifeline for NZ First, but it is the closest race outside the two big parties.
- Overhang. A party that wins more electorates than its party vote entitles it to keeps the extra seats, and the House grows. Te Pāti Māori is the only party for which this is realistic. It won six Māori electorates in 2023 but is projected to win two. Each Māori electorate it wins beyond those two raises the majority threshold.
The Monte Carlo simulation of 1 October shows how uncertain the electorate map is. On average, the party leading an electorate wins it in 85.3 per cent of 15,000 simulation runs. If the simulation captures the uncertainty realistically, that suggests about 61 of the 71 electorates are projected correctly. The uncertainty is concentrated in a small number of seats. Hamilton East is a coin toss, and so are New Plymouth, Whanganui and Northland.
Method in brief
Data: the official results of the 2023 general election, transferred onto the 71 electorates drawn by the Representation Commission in 2025 (64 general and 7 Māori electorates). The 2023 results were published only on the old boundaries, so we assigned the votes of each voting place to its 2026 electorate. Votes cast outside the voter’s home electorate (common in New Zealand, where anyone can vote at any voting place) were redistributed in proportion. The results were then updated with the poll.graphics election trend of 1 October 2026.
Nowcast: For each electorate we project each party’s share of the electorate vote. The seat distribution follows from the national party vote and the electorates won.
Seat allocation: 120 seats, Sainte-Laguë method, 5 per cent threshold or at least one electorate, overhang seats kept without compensation. This reproduces the 2023 result exactly, including the 122-seat House.
Monte Carlo simulation: 15,000 runs with random, size-dependent variation in party shares at electorate level. We count how often each party wins each electorate. The latest run uses the trend of 1 October.
What this projection cannot do
No candidate effects. Electorate votes in New Zealand are personal votes, and incumbency, high-profile candidates and retirements matter. Our model projects party strength, not candidates. Nominations close on 8 October, so for many electorates the candidates are not yet final.
No tactical voting. The model assumes electorate votes follow the national trend. Deliberate split voting, where supporters of one party give their electorate vote to a partner’s candidate, is only included at 2023 levels. Epsom, Tāmaki, Northland and Ilam are the electorates where such arrangements would matter most.
The Māori electorates are the weakest part of the projection. Their voters differ strongly from the national average: Labour and Te Pāti Māori dominate, and National is weak. A national trend fits them poorly. We treat the projected loss of four Te Pāti Māori seats with particular caution, and it is the main source of uncertainty about the size of the House.
Polls are snapshots. The trend of 1 October shows the average state of polling just over five weeks before the election. The Opportunity Party’s rise since June and the tie between National and Labour show how much can still change.
No electorate polls. This is an update of national trends applied to historical electorate patterns, not a survey carried out in each electorate.
Subscribers to “New Zealand” can see the detailed values for all 71 electorates: projected electorate vote shares by party, updated daily until election day, together with the candidates and the seat distribution.
What comes next
After nominations close on 8 October, we will update the candidates for all 71 electorates and the party lists.
On election night, 7 November, poll.graphics will follow the count.
In the following weeks we will publish a fact check: how many electorates did we project correctly, and how close were the party-vote shares? New Zealand counts special votes after election night, about a fifth of all votes, so we will only draw conclusions once the official result is declared.
Nowcast, simulation, candidates and seat distribution, updated daily and available for each electorate: