
How reliable is a projection really?
Our nowcast delivers fresh projection values every day. The Monte Carlo simulation shows how robust those values are — for every constituency, run 10,000 times.
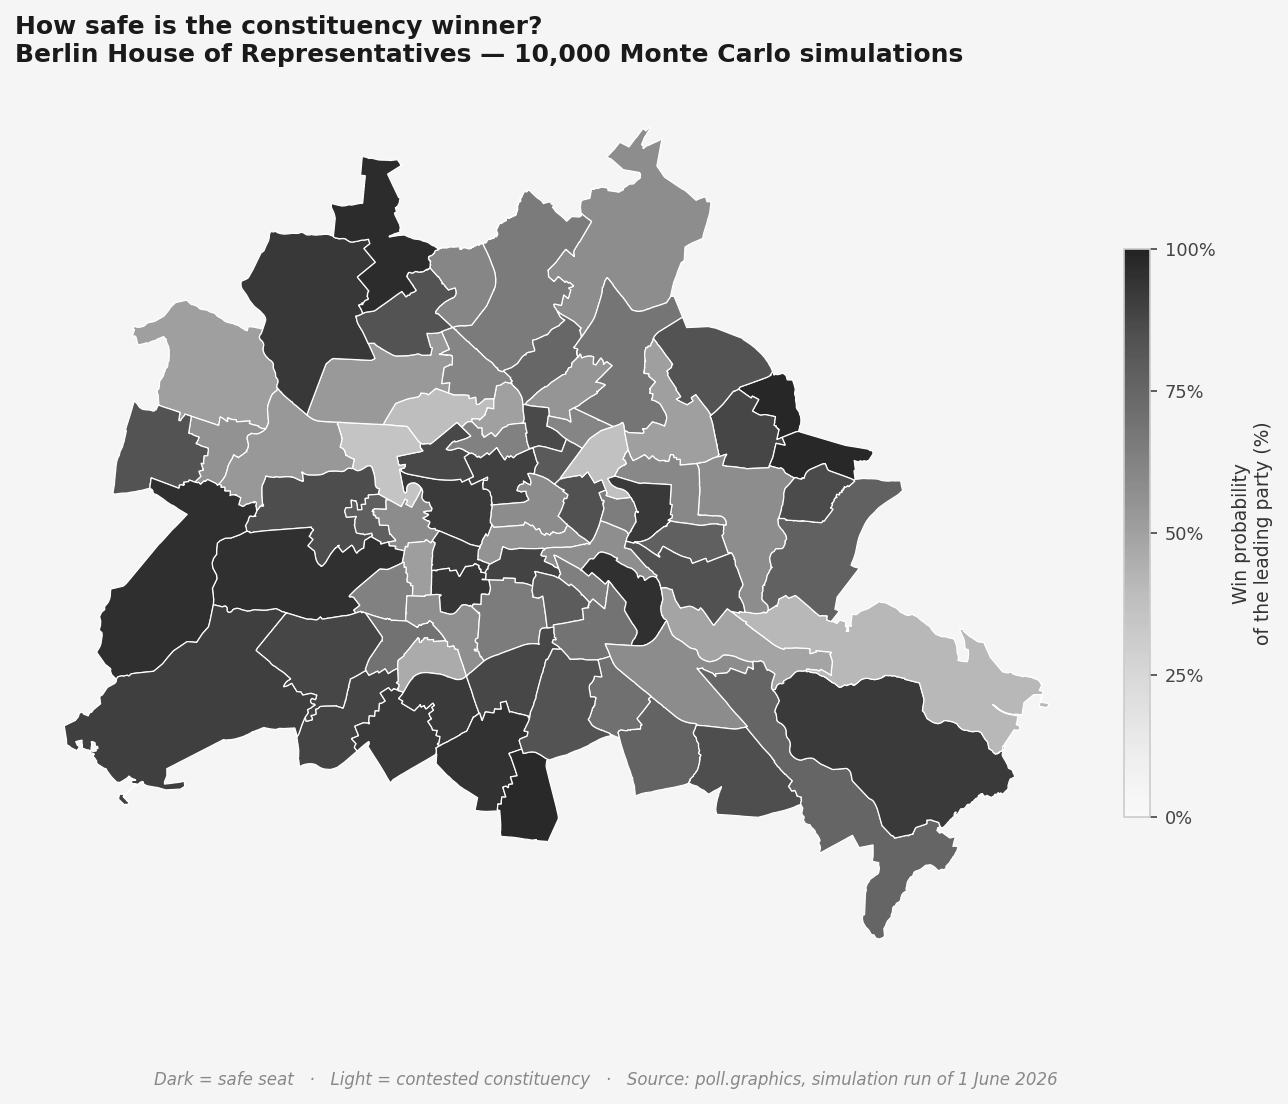
10,000 elections — so you get a number you can trust.
The method rests on a simple insight: polls are not exact measurements. Every poll has a margin of error, and that confidence interval is informative in itself — it tells you the range in which a party’s share most likely lies. The simulation uses exactly this information, systematically.
Input: the poll.graphics election trend
The starting point is the poll.graphics election trend — a weighted average of current polls that gives one percentage per party. Each of these figures is a mean with a statistical margin of uncertainty.
Simulation: vary the polling figures, calculate projections
In each of the 10,000 simulation runs, the polling figures of all parties are varied slightly — every party gets a slightly different value, drawn from a distribution around its mean. These varied figures feed into the nowcast formula and produce a hypothetical projection for every constituency. The result: 10,000 slightly different projections.
Output: a win probability instead of a point projection
After 10,000 runs we count: how often does party A win this constituency? How often party B? The result is a win probability — from 0 % to 100 %. A constituency that one party wins in more than 9,000 of 10,000 simulations is structurally different from one in which three parties each take about a third of the runs.
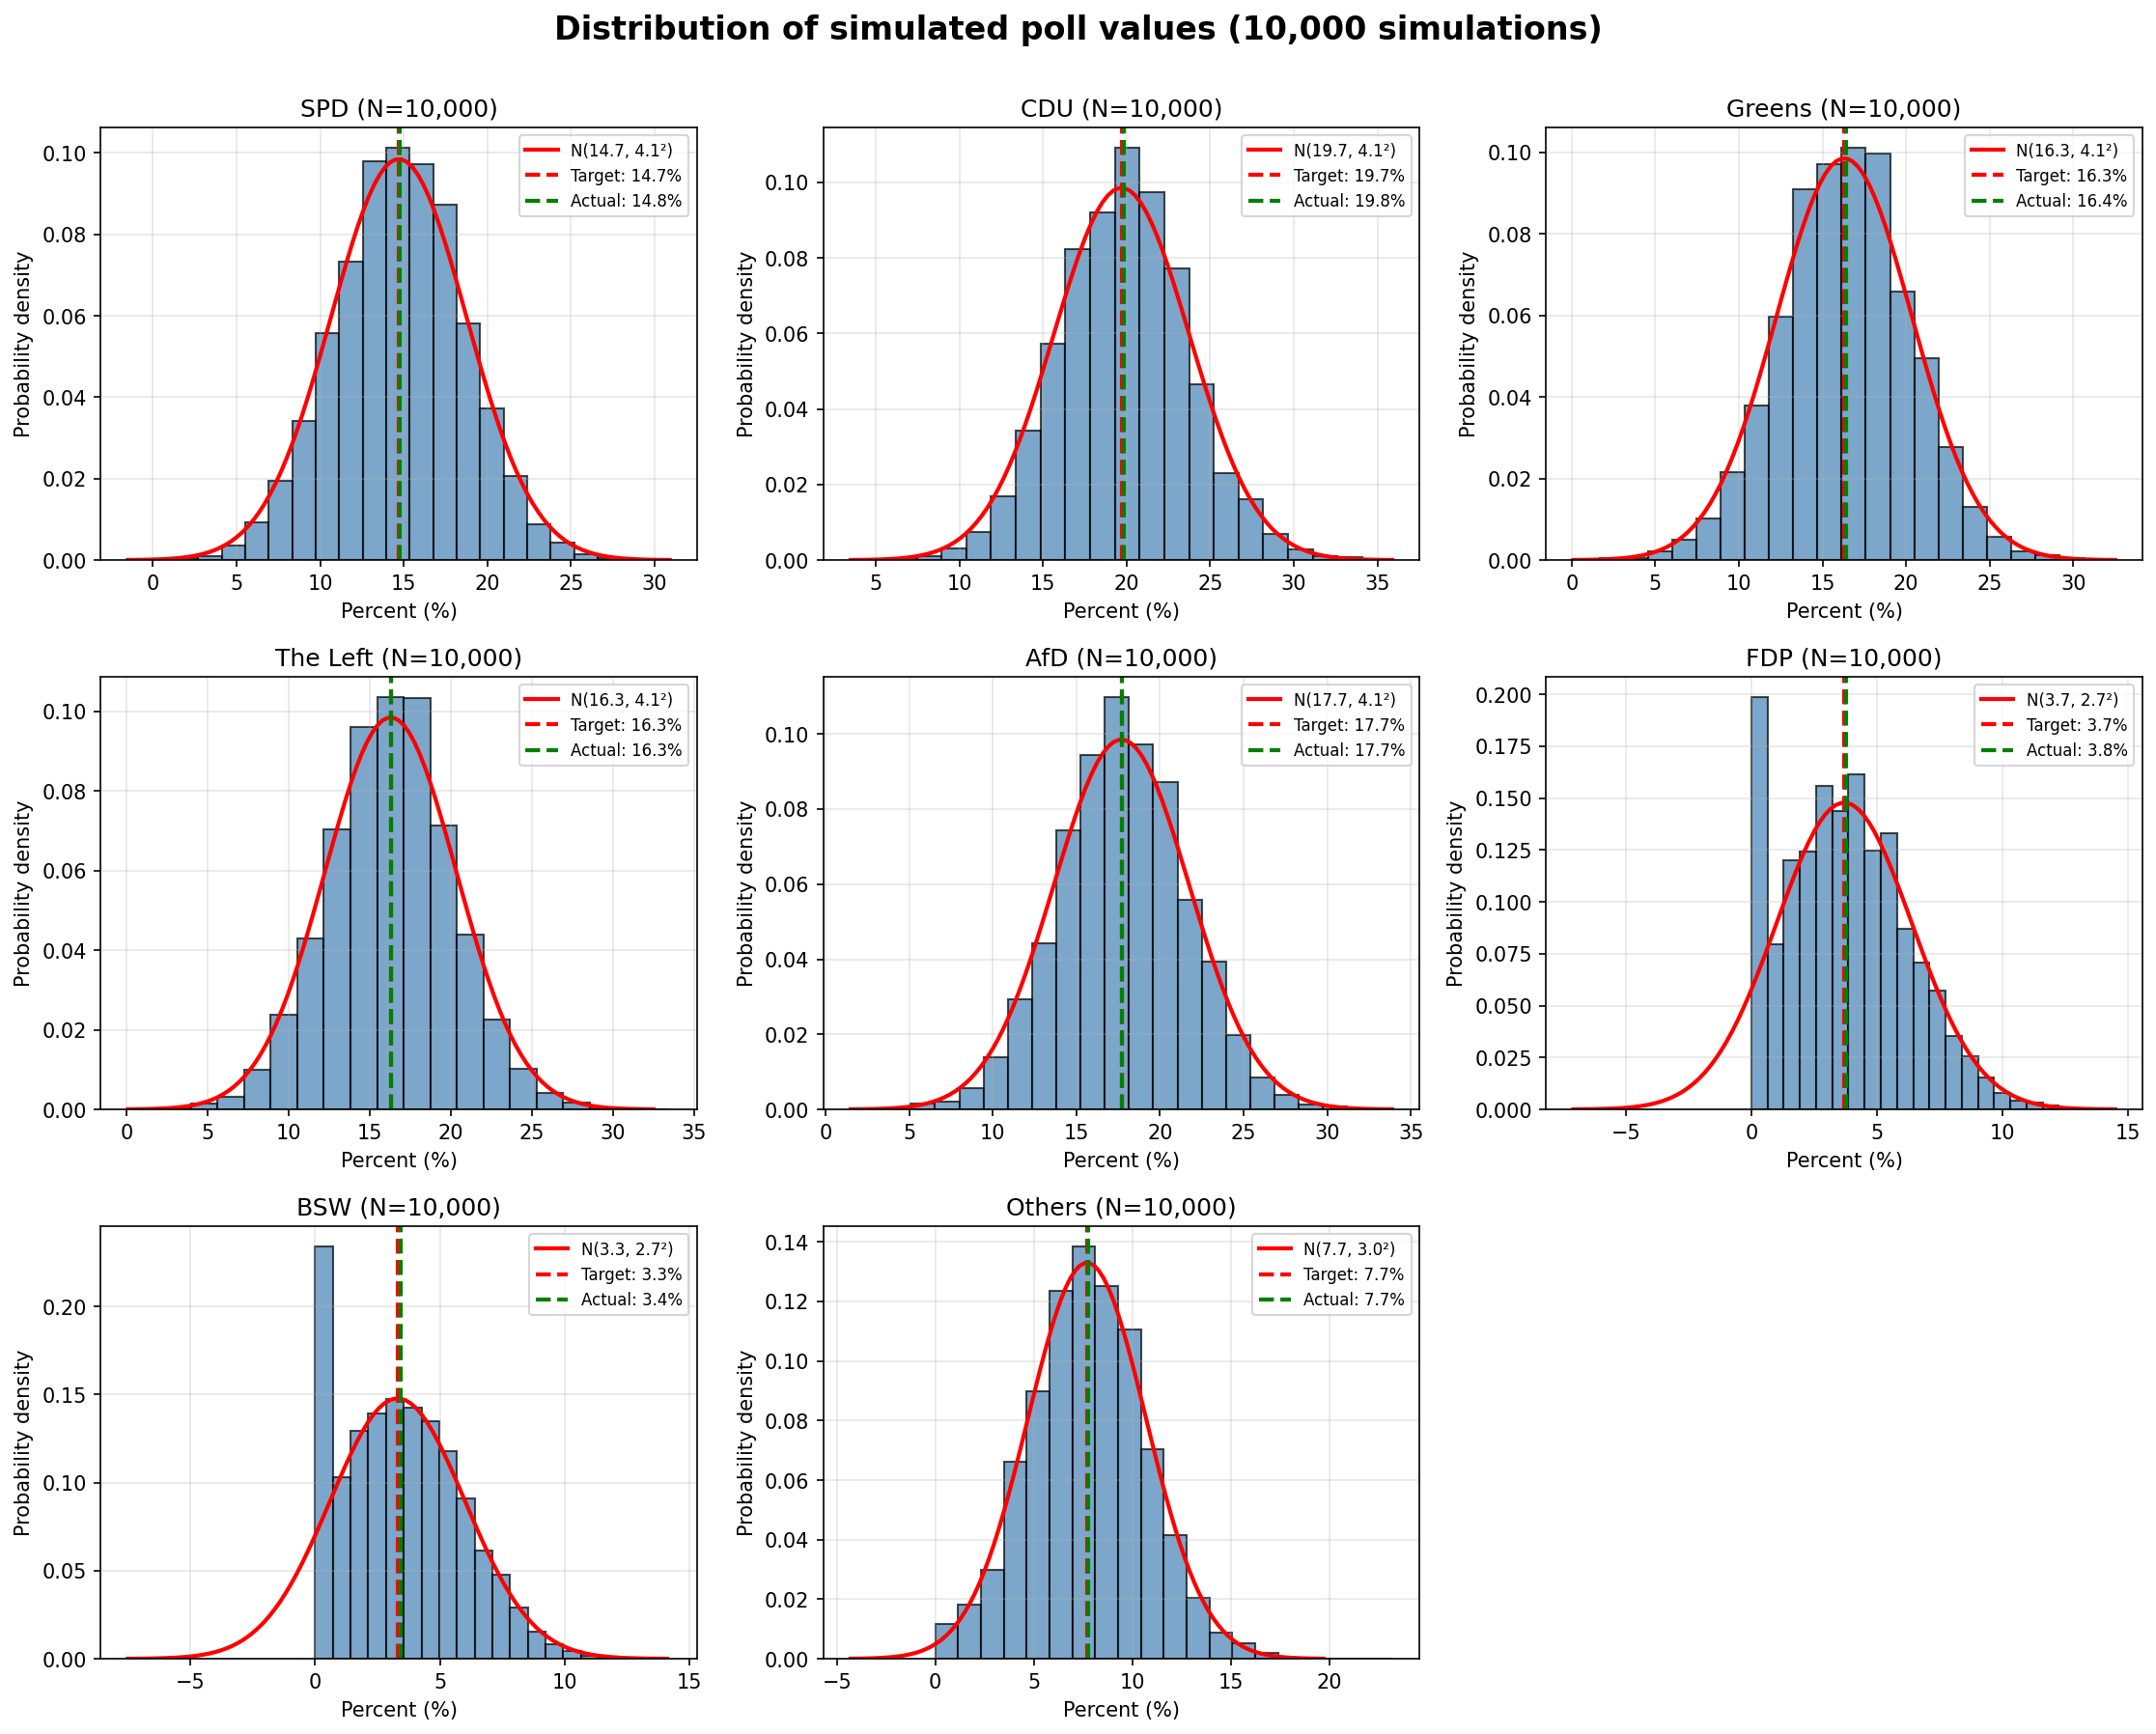
Example Charlottenburg-Wilmersdorf 1: no safe win for the CDU.
The Berlin state constituency of Charlottenburg-Wilmersdorf 1 shows what a simulation (here from 1 June 2026) can do. After 10,000 simulation runs, the picture was as follows:
| Party | Wins | Win probability |
|---|---|---|
| CDU | 3,562 | 35.6 % |
| SPD | 3,006 | 30.1 % |
| Greens | 2,869 | 28.7 % |
| AfD | 553 | 5.5 % |
| The Left | 10 | 0.1 % |
The CDU comes out ahead most often — but with a 35.6 % win probability that is no safe win. The SPD and the Greens are close behind. Three parties share almost 95 % of the simulation runs between them. A constituency in which any slight shift in the polls can tip the result.
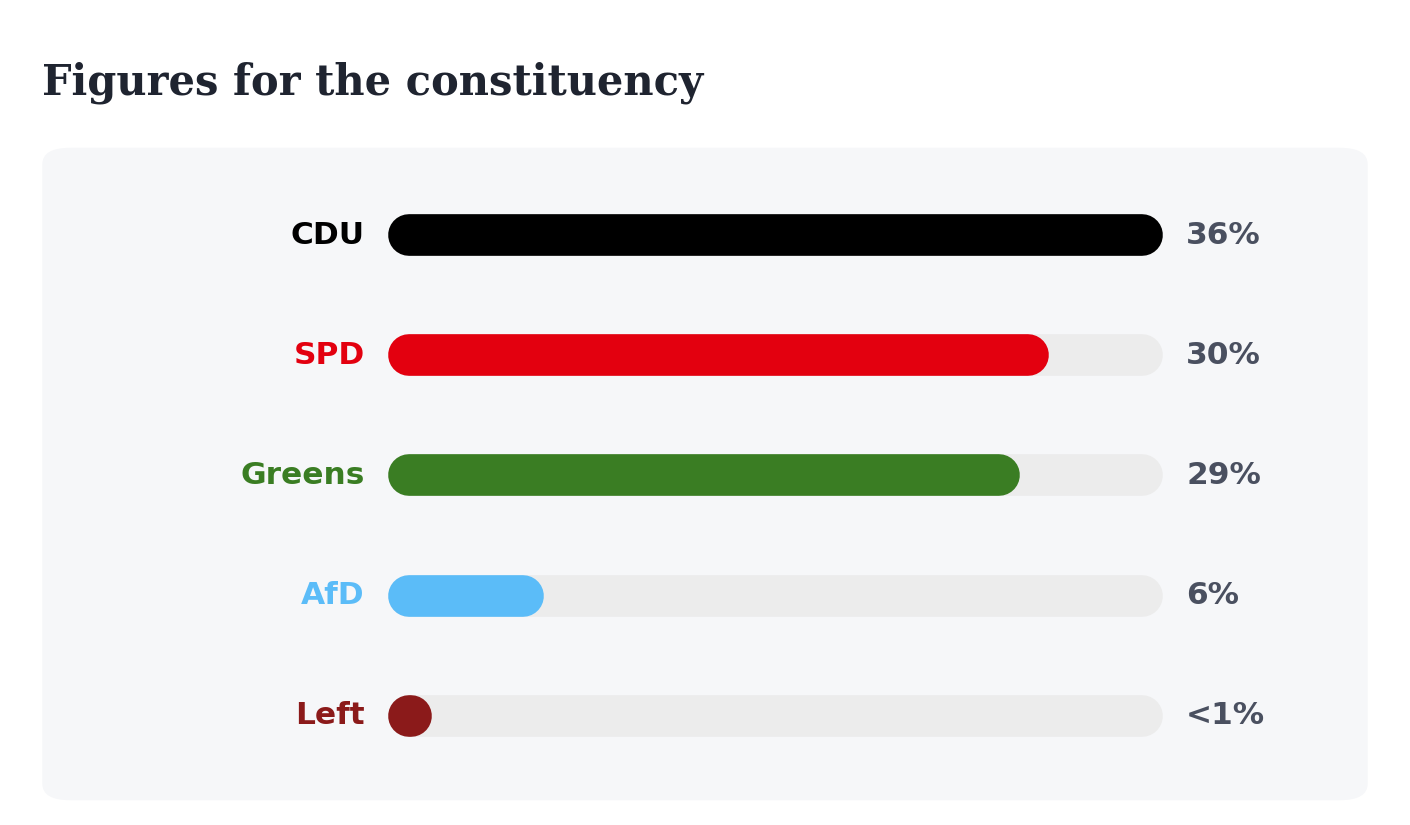
Robust or fragile? That is the real question.
A nowcast delivers a projection every day — but it does not say how stable that projection is. That is exactly what the Monte Carlo simulation does: it tests whether a result still holds when the input values fluctuate slightly.
A robust result is one that stays the same in nearly all of the 10,000 runs — one party wins well ahead of all others, however the random draw turns out. A fragile result tips over at the smallest shift: when the CDU, SPD and Greens share the wins almost evenly, a swing of a few percentage points is enough to change the order.
This distinction matters: a point projection can look identical for both kinds of constituency — the robustness behind it does not. Knowing which constituencies are structurally decided and which are genuinely open means understanding the election better. That is why, alongside the daily nowcasts, we publish a Monte Carlo simulation for every constituency at least once a month.
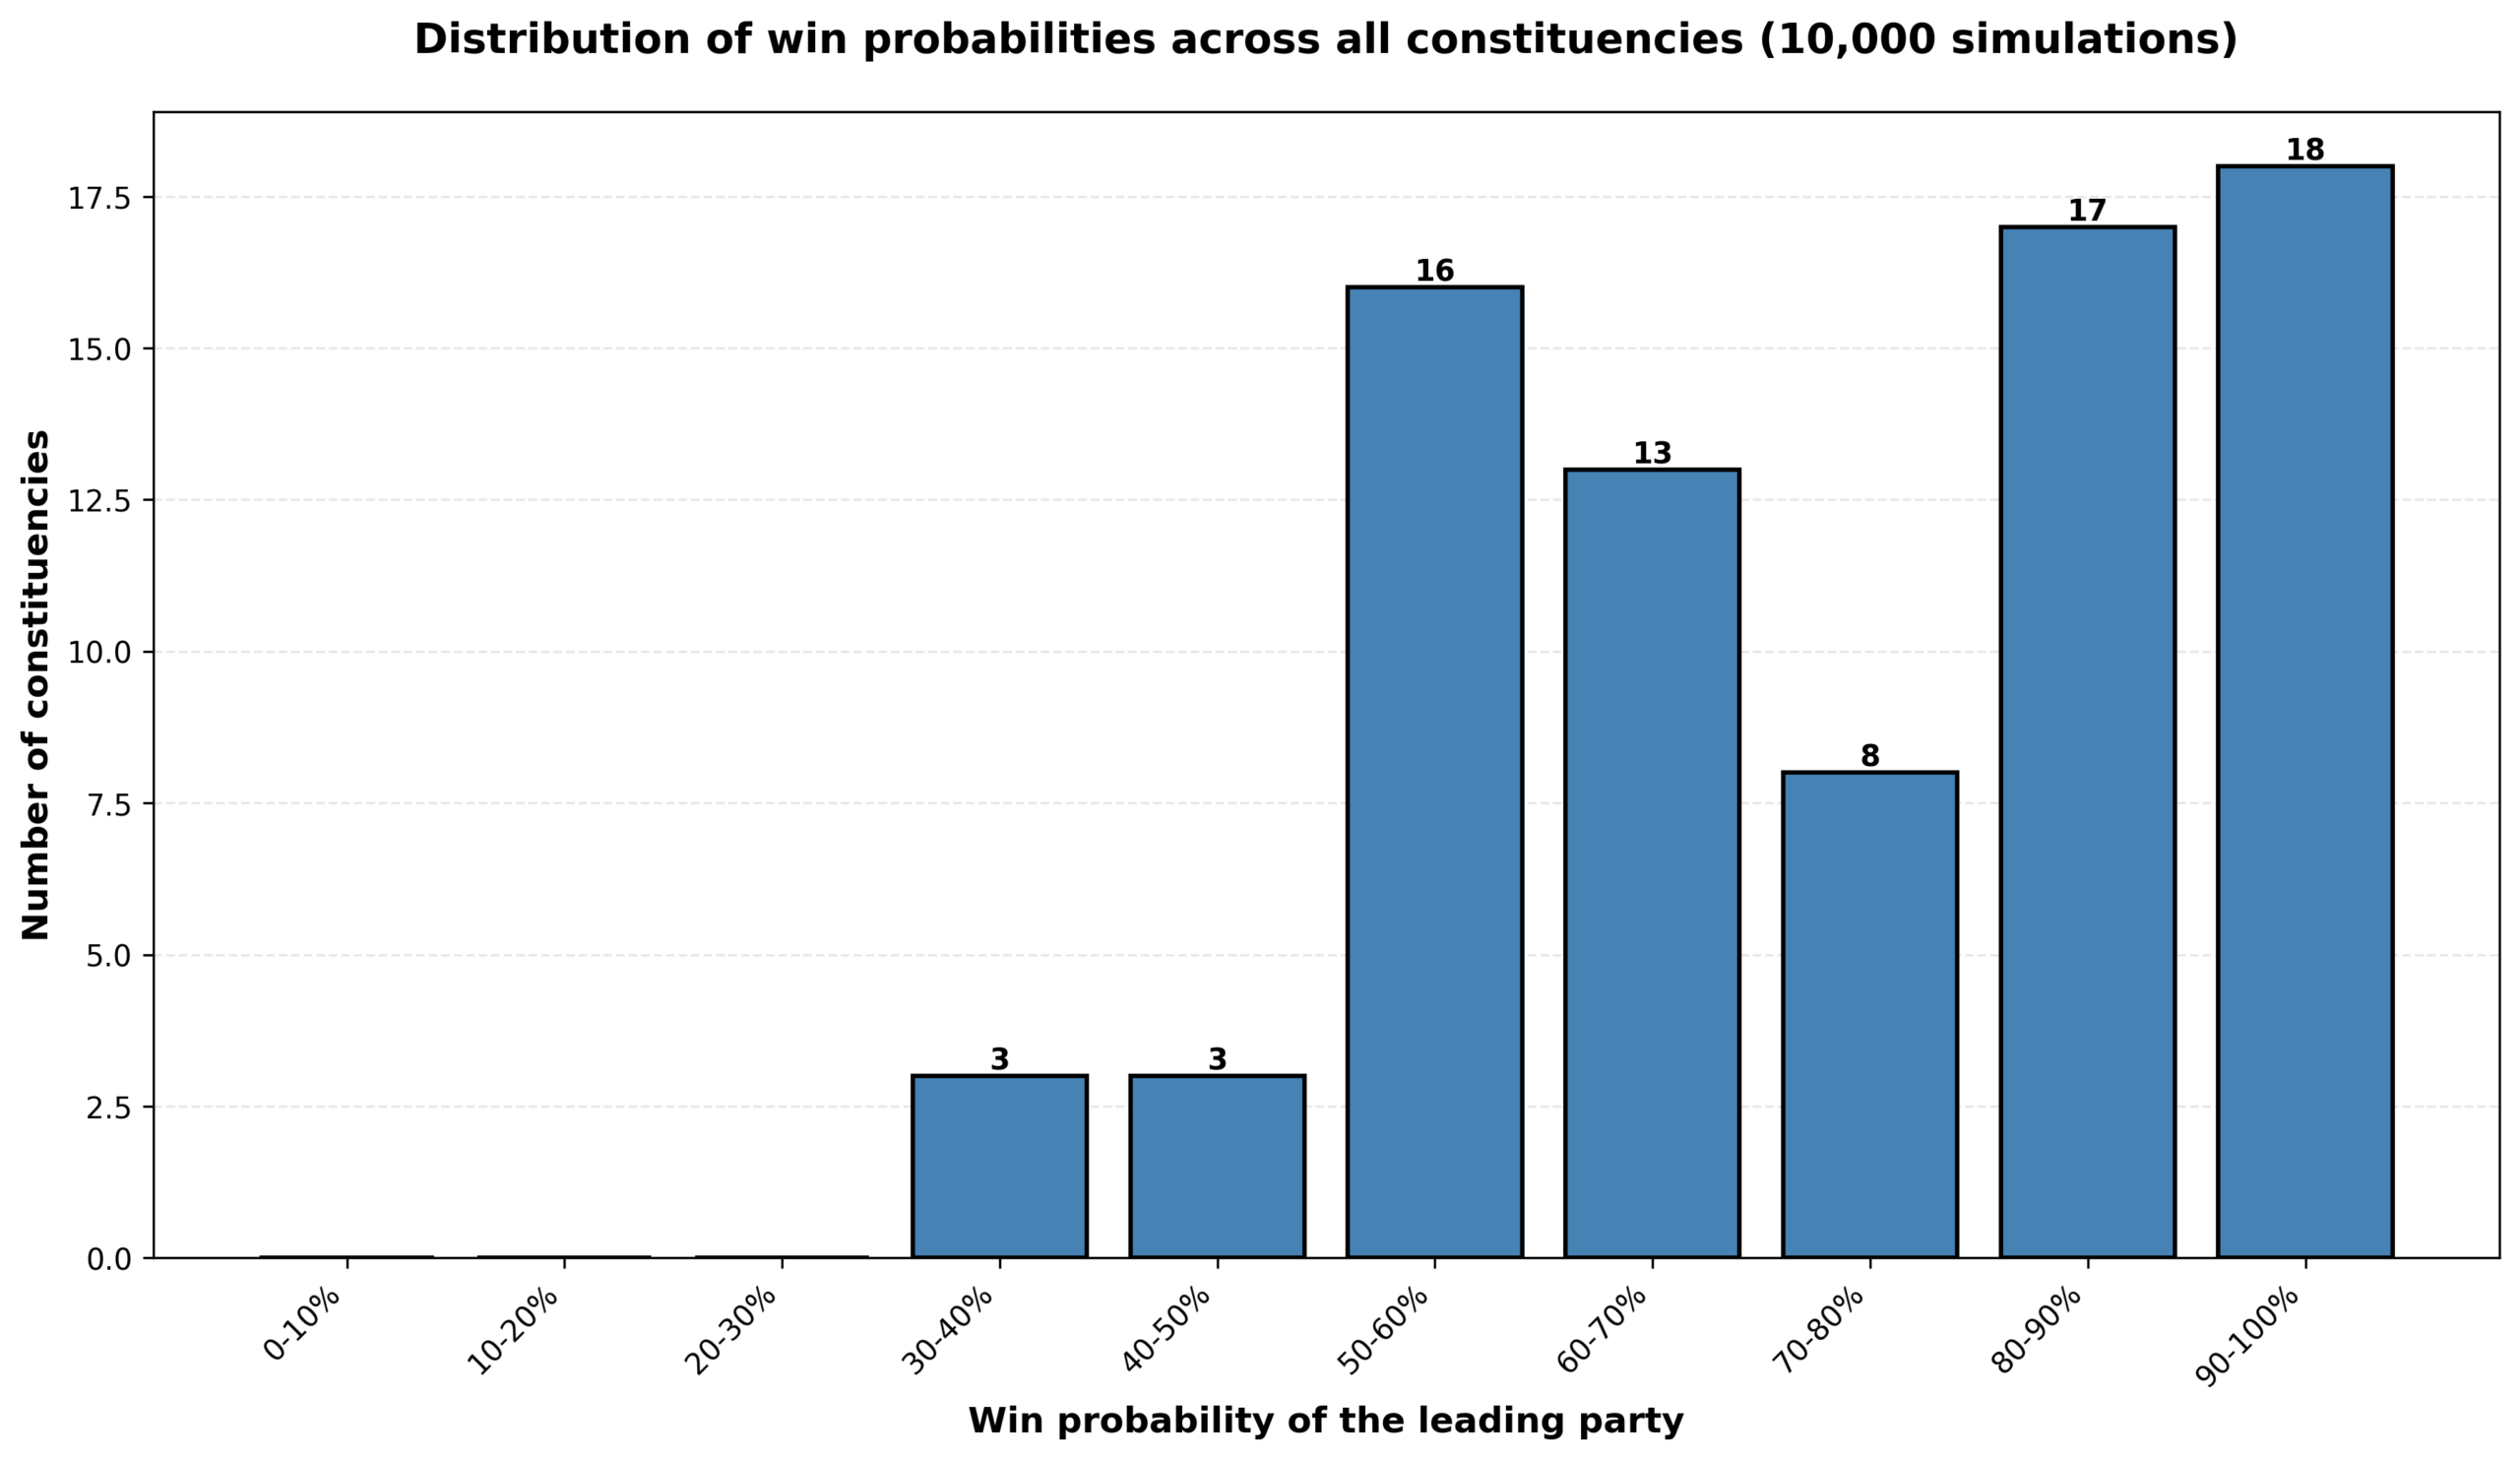
The poll.graphics nowcast is updated every day and is the basis of every Monte Carlo simulation.
For every election, the constituency maps show not only the most likely winner but the full win probability per party — based on 10,000 simulation runs.